Chart Gallery
Explore the collection of charts and data graphics
designed to illustrate possession efficiency data relationships
and college football data trends since 2007.

College Football Drive Efficiency (updated February 2021)
All non-garbage, regulation offensive drives in FBS vs FBS college football games from 2007 to 2020 are included in the data set summarized and broken down by starting field position, including the total number of drives, the average points scored per drive (PPD), the frequency rate of each drive start event, and the frequency rate of each drive end event.
Drive Start Events |
Drive End Events |
|||||||||||||||||
| Span | Drives | PPD | KO | Punt | Fum | Int | Down | FFG | TD | FGA | Punt | Down | Fum | Int | Saf | Half | ||
| 2007-20 | 232,307 | 2.14 | .430 | .387 | .054 | .059 | .041 | .029 | .267 | .130 | .411 | .051 | .050 | .076 | .002 | .012 | ||
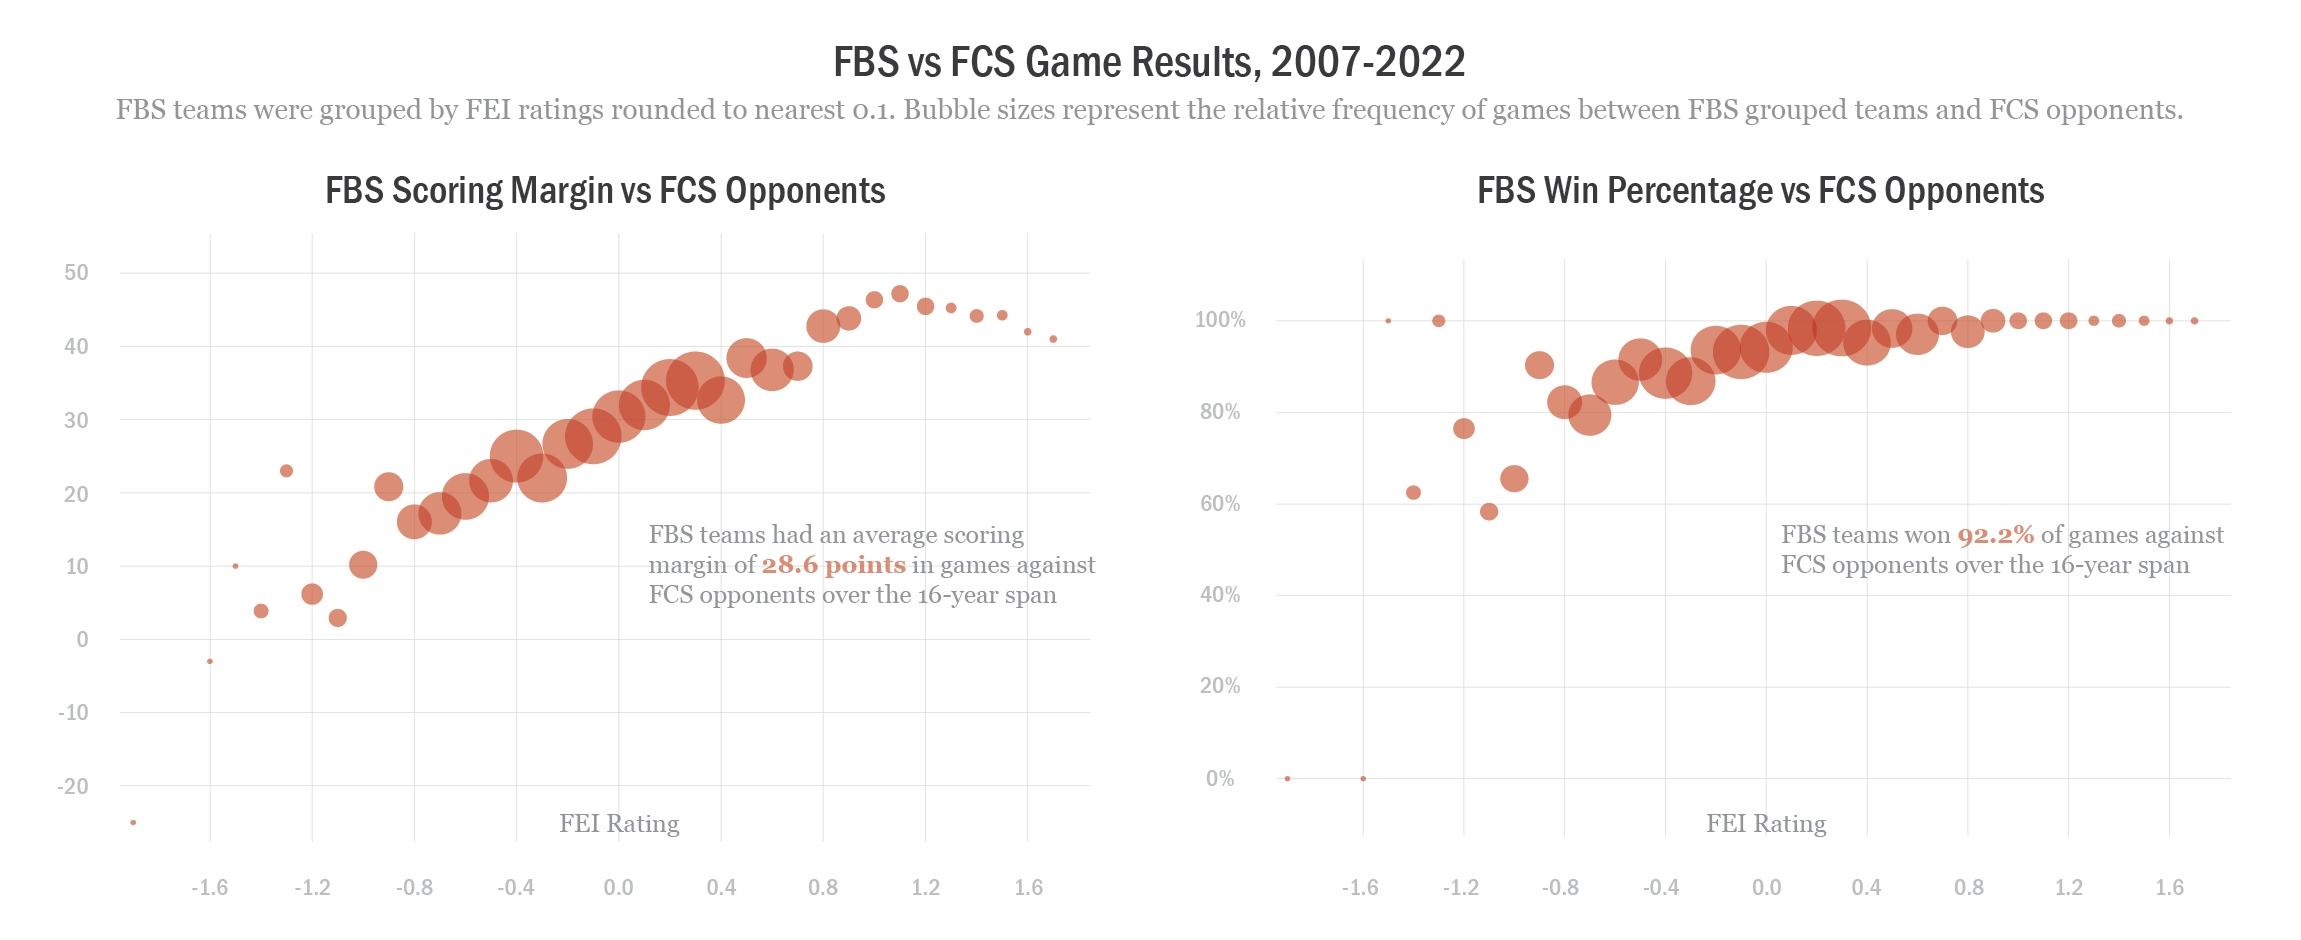
FBS vs FCS Game Results (2007-2022)
Results include the number of FBS teams (Teams) that played at least one FCS opponent, the overall record of FBS teams against FCS opponents, the average points scored (PF) and allowed (PA) by FBS teams in the games, and the average FBS scoring margin (PM) in the games. Scoring margin distribution data include the percentage of games resulting in a dominant win by the FBS team by 25 or more points (DW), a strong win by 17-24 points (SW), a moderate win by 9-16 points (MW), a narrow win by 1-8 points (NW), a narrow loss (NL), a moderate loss (ML), a strong loss (SL), or a dominant loss (DL).
FBS Teams vs FCS Opponents |
FBS Scoring |
FBS Scoring Margin Distribution |
|||||||||||||||
| Span | Teams | Games | Record | Pct | PF | PA | PM | DW | SW | MW | NW | NL | ML | SL | DL | ||
| 2007-22 | 129 | 1,590 | 1466-124 | .922 | 42.9 | 14.3 | 28.6 | .585 | .142 | .079 | .116 | .050 | .010 | .010 | .008 | ||
| Season | Teams | Games | Record | Pct | PF | PA | PM | DW | SW | MW | NW | NL | ML | SL | DL | ||
| 2007 | 78 | 80 | 70-10 | .875 | 39.4 | 14.5 | 24.9 | .438 | .250 | .063 | .125 | .075 | .025 | .013 | .013 | ||
| 2008 | 82 | 87 | 85-2 | .977 | 41.5 | 12.6 | 28.9 | .563 | .195 | .115 | .103 | .011 | .000 | .011 | .000 | ||
| 2009 | 87 | 94 | 89-5 | .947 | 40.9 | 11.8 | 29.1 | .596 | .138 | .064 | .149 | .032 | .011 | .011 | .000 | ||
| 2010 | 85 | 90 | 83-7 | .922 | 41.1 | 12.8 | 28.3 | .589 | .167 | .056 | .111 | .078 | .000 | .000 | .000 | ||
| 2011 | 93 | 97 | 91-6 | .938 | 43.0 | 14.8 | 28.2 | .577 | .206 | .031 | .124 | .031 | .010 | .000 | .021 | ||
| 2012 | 101 | 108 | 98-10 | .907 | 42.0 | 12.9 | 29.1 | .620 | .102 | .093 | .093 | .046 | .019 | .028 | .000 | ||
| 2013 | 106 | 111 | 95-16 | .856 | 42.9 | 15.6 | 27.3 | .541 | .090 | .117 | .108 | .072 | .027 | .027 | .018 | ||
| 2014 | 103 | 108 | 100-8 | .926 | 43.1 | 14.6 | 28.5 | .583 | .102 | .093 | .148 | .065 | .000 | .009 | .000 | ||
| 2015 | 102 | 105 | 96-9 | .914 | 45.3 | 14.6 | 30.7 | .610 | .143 | .067 | .095 | .067 | .010 | .000 | .010 | ||
| 2016 | 109 | 113 | 103-10 | .912 | 43.5 | 14.9 | 28.6 | .593 | .168 | .071 | .080 | .080 | .000 | .009 | .000 | ||
| 2017 | 98 | 98 | 89-9 | .908 | 42.2 | 14.7 | 27.6 | .551 | .143 | .133 | .082 | .061 | .010 | .010 | .010 | ||
| 2018 | 109 | 112 | 105-7 | .938 | 47.3 | 16.2 | 31.1 | .643 | .116 | .080 | .098 | .045 | .009 | .009 | .000 | ||
| 2019 | 109 | 114 | 111-3 | .974 | 43.0 | 13.9 | 29.1 | .596 | .114 | .088 | .175 | .018 | .000 | .000 | .009 | ||
| 2020 | 31 | 36 | 34-2 | .944 | 41.9 | 16.7 | 25.2 | .500 | .139 | .111 | .194 | .000 | .028 | .000 | .028 | ||
| 2021 | 115 | 117 | 105-12 | .897 | 42.0 | 14.5 | 27.5 | .598 | .111 | .060 | .128 | .060 | .017 | .017 | .009 | ||
| 2022 | 116 | 120 | 112-8 | .933 | 43.9 | 13.7 | 30.3 | .650 | .142 | .050 | .092 | .033 | .008 | .008 | .017 | ||
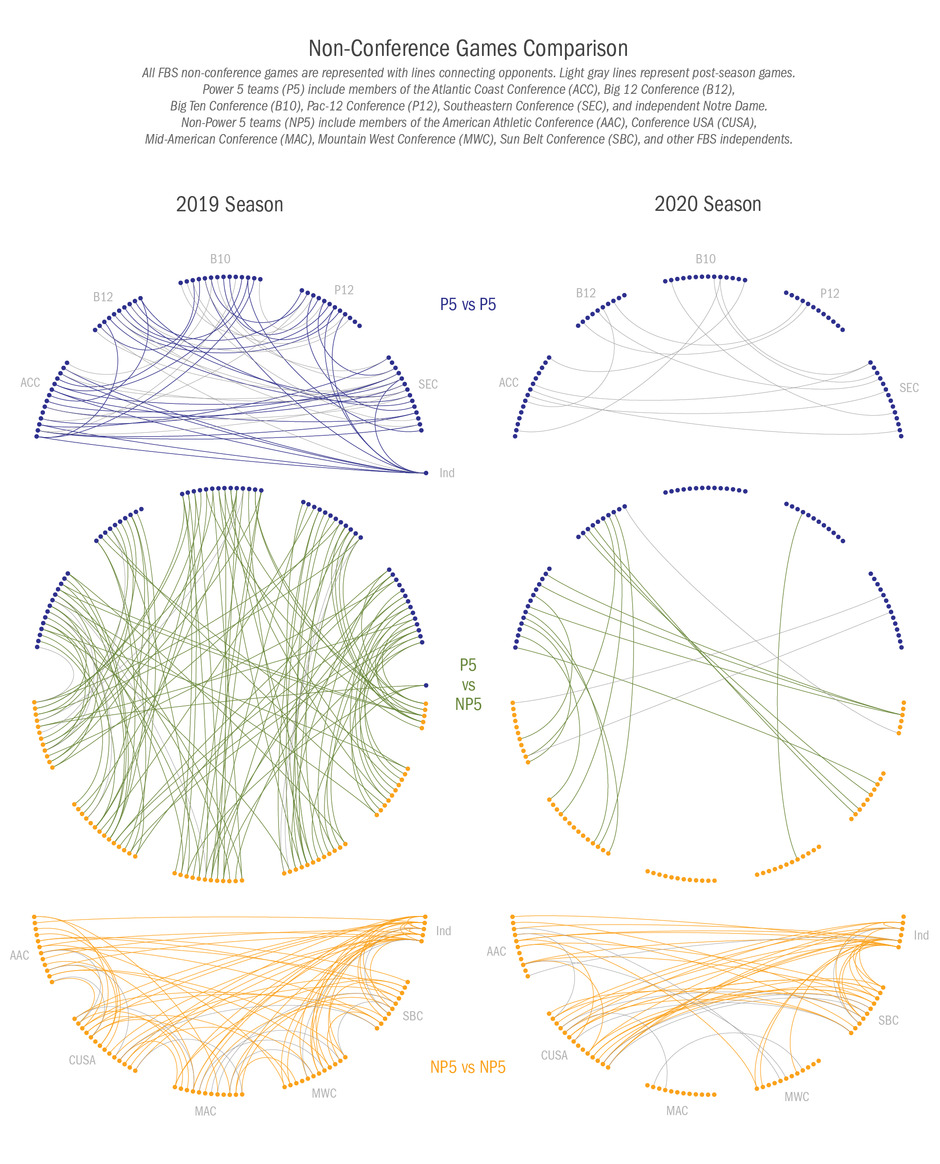
Games Played Between FBS Conferences in 2020 |
|||||||||||
| ACC | B12 | B10 | P12 | SEC | AAC | CUSA | MAC | MWC | SBC | Ind | |
| ACC | - | 1 | 2 | 0 | 3 | 2 | 3 | 0 | 0 | 1 | 3 |
| B12 | 1 | - | 0 | 2 | 1 | 1 | 2 | 0 | 0 | 3 | 1 |
| B10 | 2 | 0 | - | 0 | 3 | 0 | 0 | 0 | 0 | 0 | 0 |
| P12 | 0 | 2 | 0 | - | 0 | 0 | 0 | 0 | 1 | 0 | 0 |
| SEC | 3 | 1 | 3 | 0 | - | 2 | 0 | 0 | 0 | 0 | 0 |
| AAC | 2 | 1 | 0 | 0 | 2 | - | 3 | 0 | 3 | 4 | 6 |
| CUSA | 3 | 2 | 0 | 0 | 0 | 3 | - | 1 | 0 | 14 | 10 |
| MAC | 0 | 0 | 0 | 0 | 0 | 0 | 1 | - | 1 | 0 | 0 |
| MWC | 0 | 0 | 0 | 1 | 0 | 3 | 0 | 1 | - | 0 | 3 |
| SBC | 1 | 3 | 0 | 0 | 0 | 4 | 14 | 0 | 0 | - | 8 |
| Ind | 3 | 1 | 0 | 0 | 0 | 6 | 10 | 0 | 3 | 8 | - |
| FBS conferences include the Atlantic Coast Conference (ACC), Big 12 Conference (B12), Big Ten Conference (B10), Pac-12 Conference (P12), Southeastern Conference (SEC), American Athletic Conference (AAC), Conference USA (CUSA), Mid-American Conference (MAC), Mountain West Conference (MWC), and Sun Belt Conference (SBC). For the purposes of this table, independents (Ind) are treated as a distinct conference. | |||||||||||